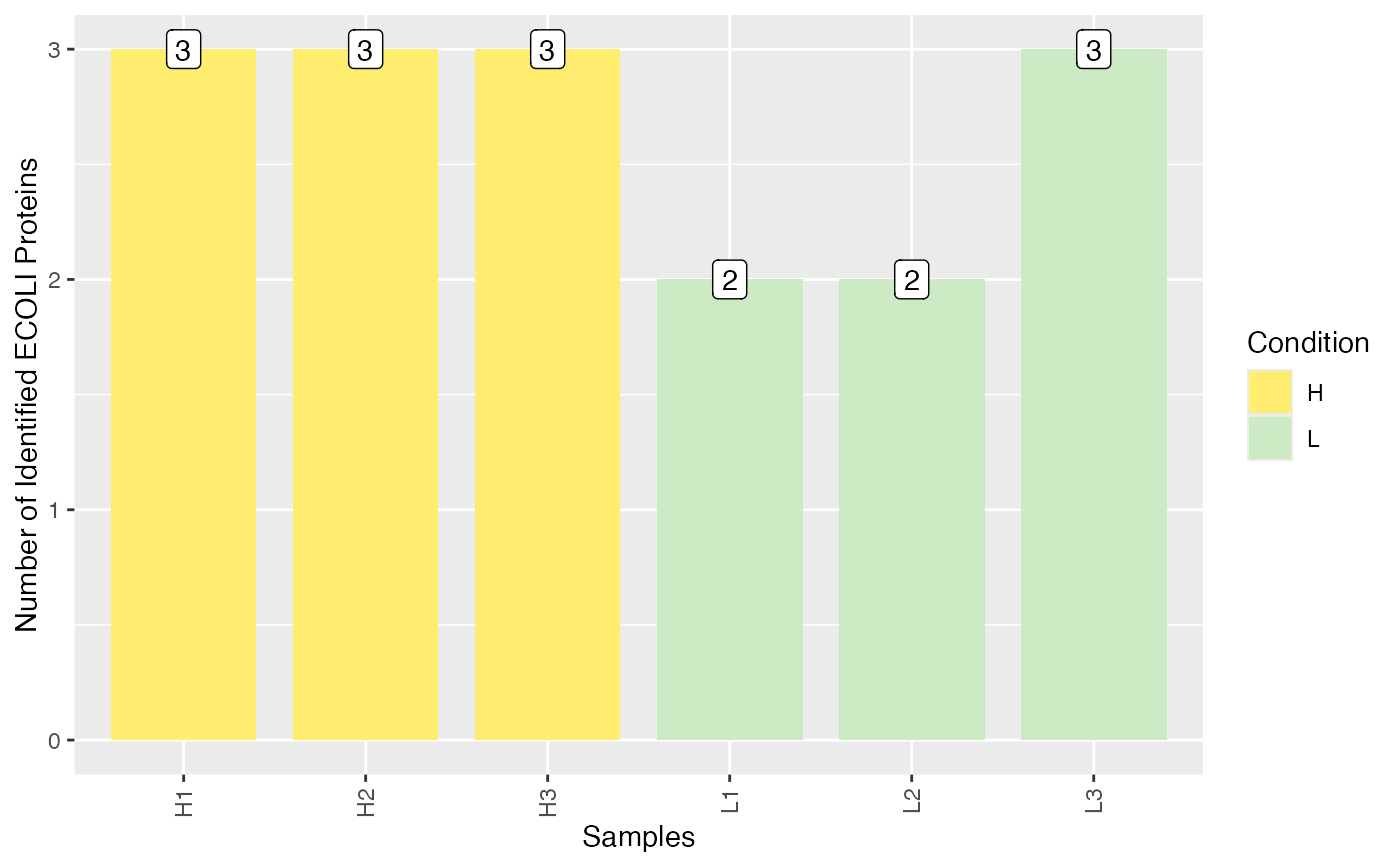
Plot number of identified spike-in proteins per sample.
Source:R/SpikeOverview.R
plot_identified_spiked_proteins.RdPlot number of identified spike-in proteins per sample.
Arguments
- se
SummarizedExperiment containing all necessary information of the proteomics data set
- color_by
String specifying the column to color the samples (If NULL, the condition column of the SummarizedExperiment object is used. If "No", no color bar added.)
- label_by
String specifying the column to label the samples (If NULL, the labels column of the SummarizedExperiment object is used. If "No", no labeling of samples done.)#'
Examples
data(spike_in_se)
plot_identified_spiked_proteins(spike_in_se, color_by = NULL,
                                label_by = NULL)
#> Condition of SummarizedExperiment used!
#> Label of SummarizedExperiment used!
#> Warning: `summarise_each()` was deprecated in dplyr 0.7.0.
#> ℹ Please use `across()` instead.
#> ℹ The deprecated feature was likely used in the PRONE package.
#>   Please report the issue at <https://github.com/daisybio/PRONE/issues>.
#> Warning: `funs()` was deprecated in dplyr 0.8.0.
#> ℹ Please use a list of either functions or lambdas:
#>
#> # Simple named list: list(mean = mean, median = median)
#>
#> # Auto named with `tibble::lst()`: tibble::lst(mean, median)
#>
#> # Using lambdas list(~ mean(., trim = .2), ~ median(., na.rm = TRUE))
#> ℹ The deprecated feature was likely used in the PRONE package.
#>   Please report the issue at <https://github.com/daisybio/PRONE/issues>.